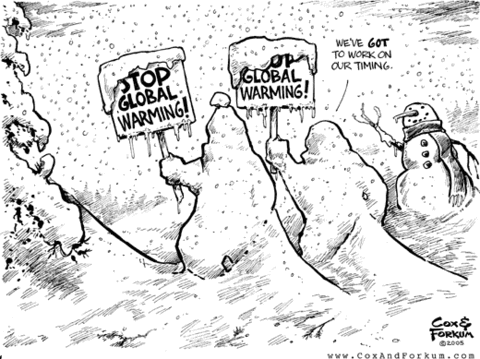
Global Warming... BUT!
A 2009 blog post. (Updated 2025)
For the last few years there's been a lot of talk about Global Warming. It now seems to be accepted as a 'fact' and pretty well everyone wants 'them' to do something about it. But is it a 'fact'? There are still those who deny it just as there are some who deny smoking is harmful. Well I'm convinced about the harm smoking does but is Global Warming a threat to us? This article sets out to clear up some of the issues.
First we need to be clear about what we mean by Global Warming. It's no use defining it as a process where the Earth is going to get hotter - that happens from night to day and from winter to summer. So here is my definition of Global Warming:
Global warming is the process where man made changes to the environment make the Earth hotter than it would be without those man made changes.
There - that definition rules out natural changes we have no control of such as the Sun getting hotter, volcanoes, earthquakes and the orbit of the planet each of which do make the Earth hotter or colder. We just need to look at the changes we've made and figure out if they are warming the planet. Except it isn't quite that simple.
To make a start we need to look at natural changes and understand how they affect the Earth's temperature. Here's a table of what I found. Pretty well all of this can be regarded as being facts rather than speculation:
| Change |
Timescale |
How it affects the Earth |
| Sunspot cycle (Schwabe cycle) |
9-12 years. Averages 11 years |
varies the heat from the sun by 0.07% or 1.3 Watts per square metre. Radiation is highest when sunspots are at maximum. The effect is great enough to affect the price of crops. Last minimum was April 2008 and the next maximum is expected 2013. |
| Changes in Sun activity - See below: |
varies with an average of 205 years |
Currently at an all time high with the start of a decline expected about 2040 |
| Solar activity Long term solar cycles |
Numerous |
Cycles have been discovered of:
87 years (Gleissberg cycle - warming from 1986 to 2030)
105 years (Suess cycle - cooling from 2002 to 2107)
131 years
210 years
232 years (warming from 1898 to 2038)
385 years
504 years
805 years
2,241 years
2,300 years (Hallstatt cycle)
6000 years |
| Eccentricity of the Earth's orbit |
413,000 years |
Varies from a value of 0.005 (nearly circular) to 0.058 (elliptical) Currently at 0.0167 and the difference between closest approach to the Sun (perihelion) and furthest distance (aphelion) is only 5.1 million km. This difference is equivalent to about a 6.8% change in incoming solar radiation. Perihelion presently occurs around 3 January, while aphelion is around 4 July. |
| Tilt of Earth's axis |
41,000 years |
The greater the tilt the less solar radiation received at the poles in winter and the warmer the summer. Varies between 22.1° and 24.5°; Currently, this angle is 23.44° and is decreasing. |
| Axial Precession |
26,000 years |
As the Earth spins it wobbles like a top running down. The effect is for the seasons to take place at different points on the Earth's orbit making winters and summer warmer or cooler. |
| Apsidal precession |
20,000 years |
The Earth's orbital ellipse slowly revolves around the sun this has the effect of changing the precession from 26,000 to 22,000 years. In 10,000 years mid-summer day will occur on Jan 4 in the Northern Hemisphere |
| Orbital inclination |
100,000 years |
A slow change of the Earth's orbit relative to the plane of the solar system; seems to be linked to ice ages. Although the change in theory makes little difference to the sunlight received it is believed that the change of plane takes the Earth into an orbit where it passes through a dust cloud which cuts down solar radiation. Today we are in an interglacial period, which marked the beginning of the Holocene epoch. This began between 10,000 and 15,000 years ago and the northern ice sheets from the last Ice age have been melting ever since. |
| Volcanoes |
irregular |
Volcanic eruptions put dust into the atmosphere which cools the Earth; affects a few years only; no recent eruptions of significance. To cause a longer term event the volcano needs to put dust and sulphur dioxide into the stratosphere. Most volcanoes do not do this. |
| Earthquakes |
irregular |
A major earthquake can produce dust in the atmosphere causing short term cooling. |
| Cosmic rays |
irregular |
A nova or supernova explosion can influence our climate but this is far from a regular occurrence, the last being two million years ago. The most likely next candidate would be the star Antares which is three times as far away as the last event. |
Now - let's see what this would lead us to expect, ignoring any 'global warming' for the moment. First it seems that in the two winters following a sunspot minimum you aught to get one which is much colder than usual. The Earth's oceans act as a heat sink causing the delay. We (in 2009) have just passed a sunspot minimum so we could expect the 2010/2011 winter to be colder than usual. This would be especially likely if a major eruption occurs in the Philippines as expected. Conversely summers at a sunspot maximum should be hotter than usual so expect summers to gradually get hotter with 2013-15 being scorchers! Added to this the Earth should gradually be warming at least until 2040 when the temperature will start to fall.
Countering this as far as the Earth's orbital changes are concerned over the next thousand years or so we should start cooling down as cool summers are not enough to melt the previous year's ice. This will be most noticeable at the South Pole which at the moment is further away from the sun in winter.
So the changes in solar output will heat the Earth until at least 2040 and the Earth's orbit will cool the Earth over an even longer period. Overall I would expect it to get hotter for a while at least, especially true in the Northern hemisphere which receives 6.8% more heat in summer than the southern hemisphere. Of course a major volcanic eruption could change all this making the Earth cooler as dust from the eruption darkens the skies.
The obvious thing now is to see how that fits in with observed weather patterns.
First here's a graph showing average temperatures at the South Pole over the last 800,000 years. The temperatures are calculated from the relative abundances of gas isotopes trapped in the ice cores
Now - What about the North Pole? We have to look at Greenland ice cores which don't cover such a long period since the Greenland ice cap has completely melted several times in the past and moves more than the EPICA ice core. This data was obtained from the NGRIP cores http://www.glaciology.gfy.ku.dk/data/PC1.txt and covers the years 1245 to 1970
Now hang on! What about global warming? We haven't got to that bit yet but despite the conflicting 'average' graphs what these ice core results show is evidence of climate warming. About 0.1°C (0.16°F) over the last 700 years. They also show that temperature variation is becoming increasingly unstable which, if you consult the top graph, is exactly what happens before a major climate shift.
Now lets take a look at some of the 'Global Warming' issues raised
Sea levels
- The 2007 IPCC (Intergovernmental Panel on Climate Change) report suggested that sea levels would rise by between 19 cm (7.5 inches) and 59 cm (23.2 inches) by the end of this century - that's a 310% difference. In the real world if your predictions vary by 310% people assume you don't know what you are talking about. Imagine being quoted £170 to £527 to paint your house.
- Sea-level rise estimates from satellite altimetry since the early 90s (about 2.8 mm/yr) exceed those from tide gauges. It is unclear whether this represents an increase over the last decades, variability, or problems with satellite calibration. - So it seems either we have a 0.25 metre (9.8 inches) sea level predicted by the end of the century or equipment we can't rely on.
- An IPCC Church and White report in 2006 suggested an acceleration of sea level rise since 1870. This is a revision since 2001, when the IPCC Third Assessment Report stated that measurements have detected no significant acceleration in the recent rate of sea level rise. - Kind of contradictory.
- Based on tide gauge data, the rate of global average sea level rise during the 20th century lies in the range 0.8 to 3.3 mm/yr, with an average rate of 1.8 mm/yr. Again a wide variation with the average indicating a 16 centimetre rise by the end of the century.
- We hear much of the risk of flooding in London, Venice and the Ganges Delta. Many people assume that this is caused by sea level rises. Each of these areas is subsiding however and it is this subsidence which poses the greatest risk. Other areas of the world are rising, we seldom hear of the problems caused by sea levels dropping. A little research on the land around the Baltic Sea between Sweden and Finland and the Clyde Estuary in Scotland will find examples of land rises.
- Recent studies of Roman wells in Caesarea and of Roman piscinae in Italy indicate that sea level stayed fairly constant from a few hundred years AD to a few hundred years ago.
- Based on geological data, global average sea level may have risen at an average rate of about 0.5 mm/yr over the last 6,000 years and at an average rate of 0.1 to 0.2 mm/yr over the last 3,000 years.
- Since the Last Glacial Maximum about 20,000 years ago, sea level has risen by over 120 metres (averaging 6 mm/yr) as a result of melting of major ice sheets. A rapid rise took place during a 'Meltwater Pulse' when sea level rose approximately 20 m over a 500 year period about 14,200 years ago. Excluding the rapid rise, sea levels rose at about 3mm per year or a little more than what it is today.
- Relative sea level rise at specific locations is often 1-2 mm/yr greater or less than the global average. Along the US mid-Atlantic and Gulf Coasts, for example, sea level is rising approximately 3 mm/yr
- Satellite measurements of sea level have only been available since 1993. The same system can measure land levels. Why are the figures not shown together?
Effect of melting ice
- During 1992-2003, the ice in East Antarctica thickened at an average rate of about 18 mm/yr while that of West Antarctica showed an overall thinning of 9 mm/yr and also increased precipitation. When global temperatures rise this causes increased precipitation. Since the average temperatures of Antarctica are well below freezing point this will mean more ice will be formed. The mean annual temperature of the interior is −43.5 °C (−46.3 °F). The coast is warmer; on the coast Antarctic average temperatures are around −10 °C (14.0 °F)
- Latest reports show that ice is now being lost in both East and West Antarctica. Why is that when air temperatures are below freezing? The answer is that glaciers at the coast are being undercut by warmer sea water which melts them. Gravity causes the glaciers to flow downhill to the sea.
- When sea ice melts it exposes a greater area of the sea to sunlight. This causes increased growth of algae which fixes carbon dioxide from the atmosphere, removing it.
- When sea ice melts less sunlight is reflected and the sea warms more. The warmer water supports more plant growth.
- Melting sea ice itself causes no sea level rise itself but warming seawater makes it expand slightly causing a rise in sea level.
Greenhouse gases
- Greenhouse gases are listed below in the order in which they cause warming:
- Water vapour (Causes 4 times the warming of an equal volume of CO2) Makes on average 1-4% of the volume of air but varies dependent on temperature and humidity.
- Carbon dioxide (CO2) Makes up 0.0387% of the volume of dry air (2009 data. It was 0.042461% in 2024)
- Nitrous Oxide (Causes 298 times the warming of CO2) Makes up 0.00003% of dry air
- Methane (Causes 25 times the warming of an equal volume of CO2) Makes up 0.000179% of dry air
- Ozone (Causes 0.3 times the warming of an equal volume of CO2) Makes up 0.000007% of dry air
- Fluorocarbons (Present in vanishingly small amounts)
- o Hydrofluorocarbons (HFCs)
- o Perfluorocarbons (PFCs)
- o Sulfur hexafluoride (SF6)
You will notice that water vapour has the greatest concentration in air and causes four times the warming effect of an equal volume of carbon dioxide. However since there is little we can do to control it it's usually ignored by global warming activists. This shouldn't be the case since the greater the temperature the more water vapour which is held by the atmosphere. Assuming an average of 1% water vapour in air then it will cause 1/0.0387 x 4 or a little over 100 times the warming of the CO2 in the atmosphere. In the same way methane causes 0.12 of the warming; nitrous oxide causes 0.23 of the warming and the other greenhouse gases are insignificant.
The fluorocarbons are all man made and will persist in the atmosphere for decades. Methane is slowly oxidised to carbon dioxide and water vapour. Half of it is oxidised within seven years. Nitrous oxide is quickly washed out of the atmosphere by rain. Fluorocarbons catalyse the destruction of ozone in the upper atmosphere changing it back to oxygen which isn't a greenhouse gas and therefore decreases the greenhouse effect. Of course that causes yet another problem - the ozone hole which leads to increased skin cancers in polar latitudes.
There's not a lot we can do about water vapour, methane and nitrous oxide have relatively little impact, ozone is desirable (at least in the upper atmosphere) and we've done as much as we are able to do about the fluorocarbons. That leaves the carbon dioxide for us to concern ourselves about so let's give it a separate section.
Carbon dioxide (CO2)
First - lets get things in perspective. Carbon dioxide is largely produced by volcanoes, by decomposition, by animals breathing and by Man burning fossil fuels in that order. About 25% of the carbon dioxide in our atmosphere is there as a direct result of Man, either by burning fossil fuels, by cutting down the rain forests or by poisoning plants in sea water which are effective at removing carbon dioxide.
In nature carbon dioxide is removed from the atmosphere by plant photosynthesis and by the gas dissolving in water. In the sea carbon dioxide is slowly converted to calcium carbonate by living organisms and this eventually forms rocks such as chalk, limestone and marble effectively removing it from the 'carbon cycle'. On land decomposition slowly returns carbon temporarily fixed by plants back to the atmosphere although small amounts fail to decompose and eventually would form new coal and oil reserves. One way in which man is affecting the carbon cycle is by preventing forest fires! When trees burn a significant amount of charcoal is produced which does not decompose and effectively removes carbon from the cycle.
There is no doubt that CO2 levels are rising as the result of Man burning fossil fuels. In the 1970s when I taught chemistry all the text books told me the concentration of CO2 in the atmosphere was 0.03% but whenever I measured it I got an answer nearer 0.04% even if I took the air sample from outside the lab.
Carbon dioxide is transparent to visible light but absorbs infra red light (heat). That's what makes it a greenhouse gas. The concern is that by putting an extra 25% of CO2 in the atmosphere we may be causing the Earth to warm up to the point which would make life difficult by changing the climate and melting the icecaps causing a sea level rise. The question is will that happen in reality or is Man's effect insignificant? Despite all the argument we still don't have a definite answer. What is known is as follows:
- Increasing the percentage of CO2 in the atmosphere promotes plant growth leading to more CO2 being fixed.
- Increasing the percentage of CO2 in the atmosphere causes the rain and sea to become more acid which decreases the rate at which CO2 is fixed.
- In the past the Earth's atmosphere has contained 20 times the current level of CO2 yet still supported animal life.
There's more to come but in the meantime here are a few extra bits of information I've come across.
- Clouds reduce the absorbed solar radiation by 48 W per square metre while enhancing the greenhouse effect by 30 W per square metre. Overall they reduce global warming by 18 W per square metre
- The height of the cloud cover is important. High level cloud cover is effective at reflecting sunlight. Low level cloud cover has little effect on heat absorption since much of the heat has already been absorbed by the atmosphere before it is reflected.
- Natural sources currently produce 20 times the amount of Carbon Dioxide as does man. Until 1750 plants kept this in balance. Since 1750 the level has been rising.
- As tundra warms, permafrost melts and releases trapped methane. The same is true for lakes normally covered by ice.
- As sea water warms it holds less carbon dioxide. This is countered by the increased growth of plant plankton which removes the excess carbon dioxide
- The total mass of termites exceeds the total mass of humanity. Termites produce CO2 and methane. The total amount of greenhouse gas produced by termites exceeds the total amount of greenhouse gases produced by Man burning fossil fuels!
- In 1988 a climate scientist appeared before the US Senate and made three predictions about temperature and the level of CO2. His lowest prediction assumed we would drastically cut the burning of fossil fuels in the 1990s (something which did not occur) and that CO2 would not force a temperature rise. His highest prediction assumed that fossil fuels would continue to be consumed exponentially and that the effect of CO2 would be significant. Although the latter consumption proved correct the climate warming since then has been 25% less than his lowest prediction. Despite this apparent error it's probably too early yet to say any of the predictions were wrong.
- Greenhouse gases are not all bad! Without them in our atmosphere the global mean temperature would be 59 F (33 C) cooler rather than the 57 F it is now. The seas would freeze solid!
- Dust and sulphur dioxide ejected into the upper atmosphere by major volcanic eruptions cause the formation of clouds which reflect sunlight causing cooling. They act as 'reverse greenhouse gases.'
- It is possible to get a fairly accurate measurement of the proportion of carbon dioxide in the atmosphere caused by mankind burning fossil fuels. Fossil fuels were produced millions of years ago and the carbon 14 isotope in them has decayed. By measuring the amount of carbon 14 in the atmosphere and comparing it with carbon dioxide trapped in pre-industrial era ice cores science can calculate how much of it was produced by burning fossil fuels. This process is known as the Suess Effect.
Temperature measurement
IPCC statement - '11 of the last 12 years have been the hottest since records began in 1850' - Question: Where and how were these temperatures recorded? Even without answering this question the statement is hardly surprising in view of the graph shown here
- Assessments by the Intergovernmental Panel on Climate Change (IPCC) suggest that the Earth’s climate has warmed between 1.1° and 1.6°F over the past century and that human activity affecting the atmosphere is "very likely" an important driving factor. It's interesting that these figures are quoted in Fahrenheit rather than the much less dramatic 0.6 and 0.9°C As to whether human activity is responsible - see the graph.
- The majority of weather measurements are made in cities and cities are well known for being warmer than the surrounding area -sparrows flock to the cities at night in winter because it's warmer there. I once lived in Teesside in the north of England, a heavily industrialised area. In winter, while it was raining in Teesside, 15 minutes drive away you would find yourself in snow.
- Cities are warmer than the surrounding countryside and as they get bigger, they get warmer still. Take New York as an example. Temperatures there are on average 5°C (8°F) warmer than the surrounding countryside.
- To compensate for the fact that temperatures are hotter in cities an 'adjustment' is made to temperature data used in global warming calculations based on the population of the city. This 'adjustment' is in reality little more than a guess since it is based on population alone and does not take account of modern industry, heating, road area, high rise buildings and air conditioning.
So what do I think?
- We still don't know enough to predict the climate
- We certainly can't predict the weather more than a few days in advance
- Predicting climate trends and predicting weather are NOT the same thing.
- Climate conferences in the middle of winter or at the height of summer are not a good idea since we tend to associate current weather with climate.
- Computer modeling of climate trends is inaccurate. No one has yet produced a model which has been proven. To make decisions based on them is asking for trouble.
- Whatever we do about fossil fuels, even if we were to suddenly stop using them, the climate temperature will rise in the near future at least until 2040
- Irrespective of trends there will be years which don't follow the pattern when we say 'So much for...'
- There is no possibility that we will be able to restrict climate warming to less than 1°C by 2040
- A call for restriction of climate warming to 1.5°C without stating a year for this to be achieved is meaningless. (Update: we exceeded this in 2024)
- How will the average temperature of the Earth be measured? We don't seem to be able to do this very accurately.
- It is arrogance for the developed countries to tell developing countries to cut back on their carbon emissions. ('We did it but you can't')
- There should be serious concern about sea level measurements. We have to get them accurate before we can say 'sea levels are rising due to global warming'.
- Fiji, with mountain peaks of 1,300 metres, is in no danger of sinking beneath the waves even if all the icecaps were to melt completely. Other island nations are not so lucky.
- There is no doubt in my mind that an increase in carbon dioxide in the atmosphere will affect the climate but whether that triggers global warming, promotes extra plant growth or causes ice caps to melt is still uncertain.
- We should be trying to cut back on our consumption of fossil fuels because they are in short supply not because of global warming.
- It is common sense to try to improve efficiency, improve insulation and develop alternative power sources but not because of global warming.
- The media love 'Global Warming'. Scaring the population about anything (eugenics, serial killers, cold war, terrorism, weapons of mass destruction, bird flu, swine flu etc.) is good for them. As far as the media is concerned a 'State of Fear' is good business. Michael Crichton covered this in his book
 and provided lots of references which are worth checking out. If you haven't read it - get a copy, I recommend it. Of course the fact that he died soon after it's publication will no doubt set some people thinking. Dr Richard Betts, head of climate impacts at the Met Office Hadley Centre feels many journalists are acting irresponsibly. In a BBC interview he said, "I have quite literally had journalists phone me up during an unusually warm spell of weather and ask 'is this a result of global warming?'. When I say 'no, not really, it is just weather', they've thanked me very much and then phoned somebody else, and kept trying until they got someone to say yes it was.
- Politicians love to climb on bandwagons and often make stupid decisions because of this. They resisted the global warming theory at first then supported it. Now there's a movement against it and it's an issue in the US presidential elections. It is folly to support legislation either for or against global warming without first funding a major inquiry on it.
- It's not a good idea to pollute the oceans with substances which kill photo-plankton.
- Sea level is rising... at the same rate as it has done for the last 12,000 years.
- We are not in danger of a 'Waterworld', a 'Day after tomorrow' or a '2012' scenario but they are entertaining films. The underlying theme of the 'Day after tomorrow' film is actually true and worth a seperate section but it's wild predictions of sudden freezing and ice age are not true.
- It is stupid to use more energy to recycle products than to produce them from raw materials. (So stop buying that recycled white paper and bring back the brown paper bag. (Could we ever tolerate recycled brown toilet roll? Yes we can, especially if it is made from unbleached bamboo )
- Scientists who come out against global warming tend to get fewer research grants than those who support it. The focus on climate change is now so huge that everybody seems to need to have some link to climate change if they are to attract attention and funding. In a 2009 issue of 'New Scientist' I found 28% of job adverts were looking for someone with enviromental interests.
- You should remember that 'science' has often supported erroneous theories such as the phlogiston theory and more recently eugenics. If it's accepted by people that does not always mean it's correct.
- Political support for eugenics led to the rise of Hitler and to the belief that 'white' races were superior to other races. Calls against climate action do nothing to improve things but could make the climate a lot worse.
- The number of scholarly articles which point against 'global warming' and then state that 'the authors support the concept of global warming' is astonishing.
- Climate scientists funded by industry will inevitably be labeled as 'biased'.
- the IPCC predictions are in need of careful scrutiny
And my climate predictions?
- The winters of 2009/10 and 2010/11 will be colder than 'usual'. Especially so if there is a major eruption anywhere in 2010.
- Summer 2013 and 2014 will be scorchers as will 2025 and 2036
- Climate temperatures will slowly rise until about 2040 then start falling, possibly very sharply.
- We are likely to experience ever more extreams of weather as we approach 2040
- Greenland's icecap will continue to melt at least until 2040
- The Antarctic ice cap will expand for a while then start to shrink until 2040. This refers to the land based ice not the sea ice around it.
- I am certain my predictions are as certain as the IPCC's are and pretty sure they will prove wrong (take that any way you want).
Climate is what we expect, weather is what we get. - Mark Twain
Updates
December 2009
Since I made this prediction back in November 2009 winter has hit us with a vengance! -20°C predicted for tomorrow and...
16th April 2010
...and now we have the eruption! A volcano in Iceland has sent a huge cloud of ash up which has already affected most of Northern Europe and has shut down all our airports since the ash is capable of causing the engines to fail. News broadcasts are talking about the disruption being for a few days but the last time this volcano erupted it took two years to settle and also triggered an even bigger eruption in a different volcano. As yet the talk is only about air travel but in a little while expect to start hearing about the cooling effect this eruption will cause. Now I wonder what would happen if that volcano in the Philippines decided to erupt this year also?
December 2 2010
Well here we are a year later and last year's record snowfall has already been beaten by the snow which started falling a full month earlier this year. Where I live, the temperature has been below freezing now for over a week and over 1 foot of snow has fallen so far. Of course it's not quite as bad as it was in 1963 - but that didn't start until February!
January 30 2012
So far the winter of 2011/2012 has been much milder - exactly as predicted. That is despite the severe cold which plagued Europe. I expect a hot summer this year with an even hotter one in 2013. It's important to remember that we are dealing with climate as a whole and that local weather in your area might seem different. It's interesting that three articles appeared on the BBC website relating to weather. In one was a report on the little ice age being caused by volcanic activity http://www.bbc.co.uk/news/science-environment-16797075 . In the other the suggestion was made that UV output from the sun might be responsible for changes in global temperature associated with solar cycles http://www.bbc.co.uk/news/science-environment-15199065. The third article? Well that's cautious about interpreting the results but in a way, says much the same as I said here back in November 2009 http://www.bbc.co.uk/news/science-environment-13792479.
April 30 2012
You might like to take a look at this article relating to the work of a Danish astronomer, Prof. Henrik Svensmark of the Technical University of Denmark, who studied how the Earth's climate has been affected by the movement of the solar system through star clusters where there is a high incidence of supernovas.
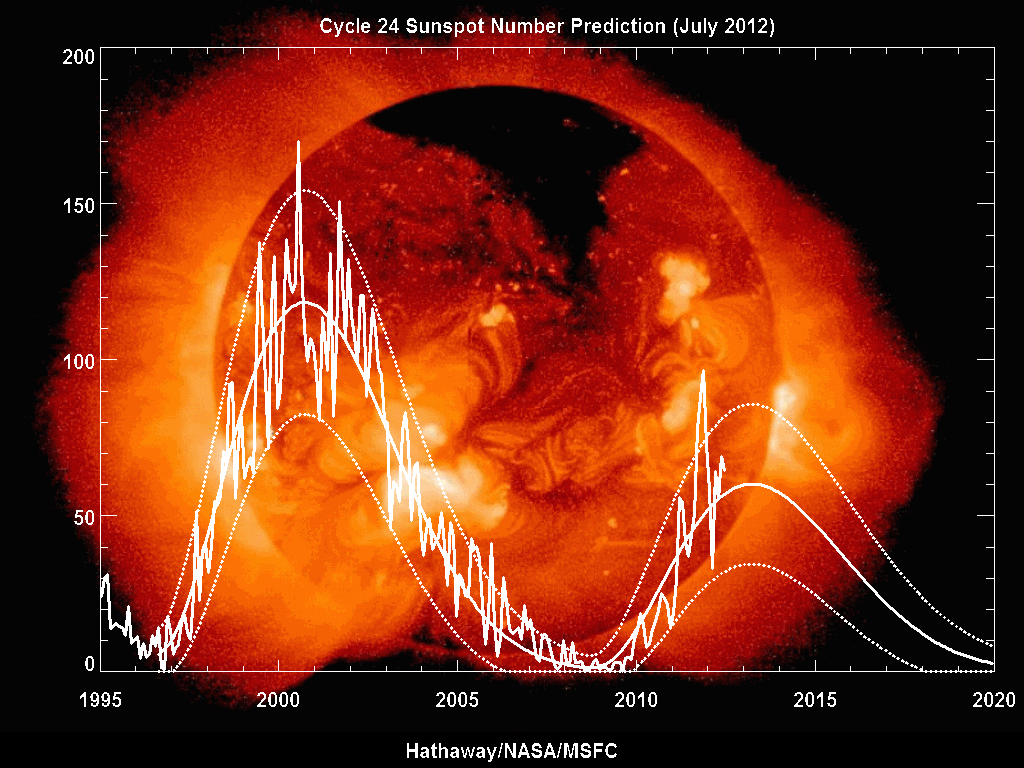
July 22 2012
Here's the latest prediction of sunspot activity. Peak activity is predicted for summer 2013. Since there is a 1-2 year delay in the weather this would indicate 2014 summer is likely to be the hottest.
September 24 2012
Well summer is now over and here in the UK we have had a cool and very wet summer. So much for my prediction of a warm one huh? Well the picture isn't quite as clear as that. In North America they have had a scorching hot summer. The UK Met office explains why it's been wet and cool in the UK but a heatwave in the US and Canada - It's all to do with the jetstream which this year, didn't quite follow it's normal pattern. Find the explanation here.
Also in the news at the BBC is a report on sea level. It seems that they are rising at an average of 3 mm per year. Err guys. Isn't that exactly what I said back in 2009 in the section on sea level? The sea has been rising at that rate (apart from the meltwater pulse 14,000 years ago) at that rate for the last 20,000 years.
The Gulf Stream and AMOC
The film "The Day After Tomorrow" depicts a scenario where the Gulf Stream and AMOC (Atlantic Meridional Overturning Circulation) abruptly shut down, leading to catastrophic freezing in the northern hemisphere.
While the basic concept has some scientific basis, the film's portrayal is highly exaggerated and unrealistic. One thing is real. The Gulf Stream and AMOC are slowing and that will have an effect.
Here's a breakdown of the science:
- The Gulf Stream and AMOC: These are crucial ocean currents that transport warm water from the tropics to the North Atlantic. The AMOC is driven by differences in water temperature and salinity, creating a "conveyor belt" effect.
- Impact of Greenland Ice Sheet Melting: The melting of the Greenland Ice Sheet could indeed disrupt the AMOC. As freshwater from melting ice enters the North Atlantic, it reduces the salinity of the water, making it less dense. This less dense water is less likely to sink, which is a key part of the AMOC process.
- Potential Consequences: A weakening or shutdown of the AMOC could lead to regional cooling in Europe and North America, as well as changes in precipitation patterns and sea level rise. However, the effects would be gradual and less dramatic than depicted in the film.
- Unlikely Sudden Freeze: A sudden, global freeze as shown in the film is highly improbable. The Earth's climate system is complex and has many stabilizing factors.
In summary, while the idea of the Gulf Stream shutting down due to climate change has scientific merit, the film's portrayal is a dramatic exaggeration. The real-world consequences would be more gradual and nuanced.


